Finzen
Your Finances, Visualized
Monthly report cards, Sankey cash flows, spending trends, portfolio performance, net worth over time. This is what financial clarity looks like.
Great financial decisions start with a clear picture
Whether you're trying to cut spending, grow your portfolio, or simply stop wondering where your paycheck went - visibility is the first step. Not spreadsheets. Not bank statements. A real, visual understanding of your financial life.
That's what Finzen is built around. From monthly Sankey cash flow to the real-time net worth chart, every visualization is designed to give you insight you can act on.


Your money has a story. It's time you read it.
See your money clearly. Watch your decisions improve.
The power of data visualization and visual storytelling.
of Americans say they're afraid to check their finances because they'll realize how much they're spending.
of people who track their income and expenses say it has helped them get out, or stay out, of debt.
of investors do not understand all the types of investments they hold in their own portfolio.
Most people have a rough sense of their finances. A ballpark. A feeling. But feelings aren't clarity, and a ballpark is just another word for a guess. The gap between what people think is happening with their money and what's actually happening is where anxiety lives.
Visibility changes everything. Not just for the numbers, but for the behavior.
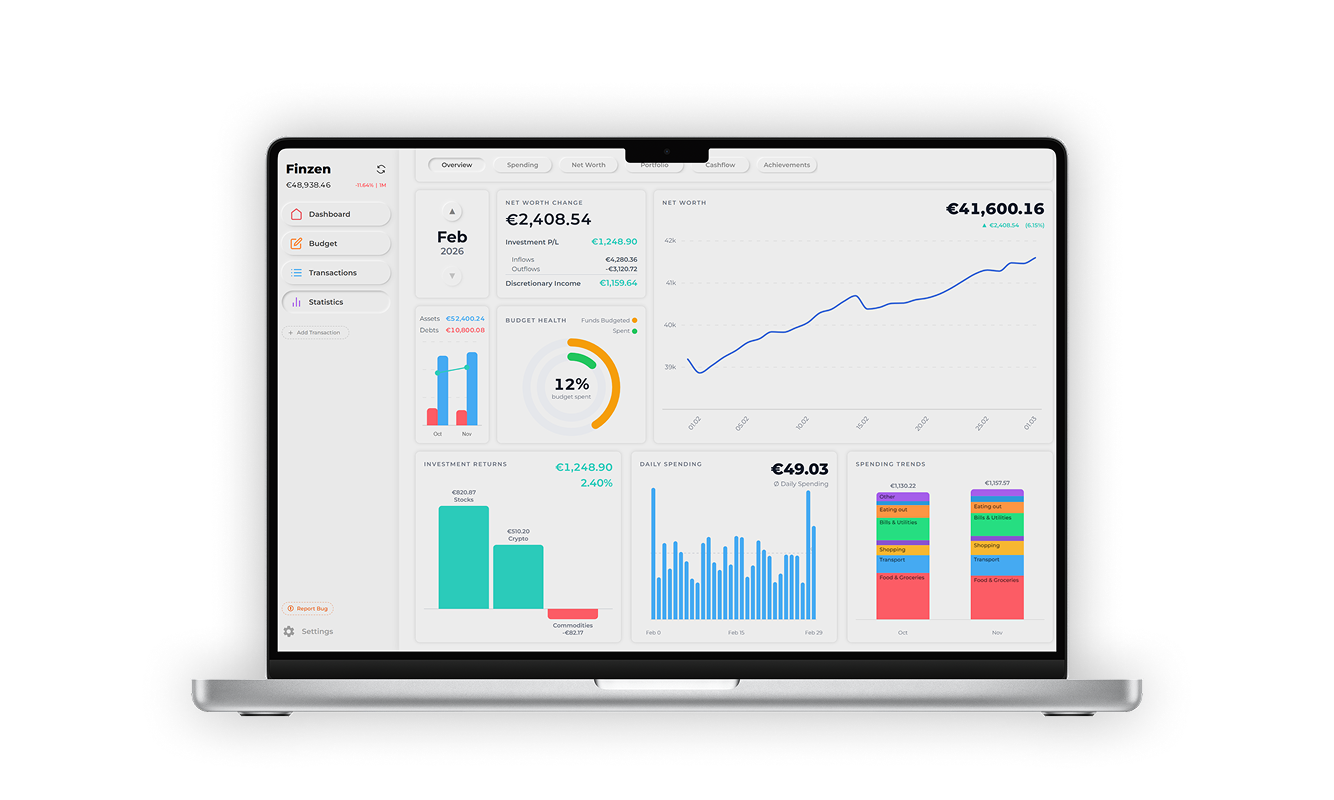
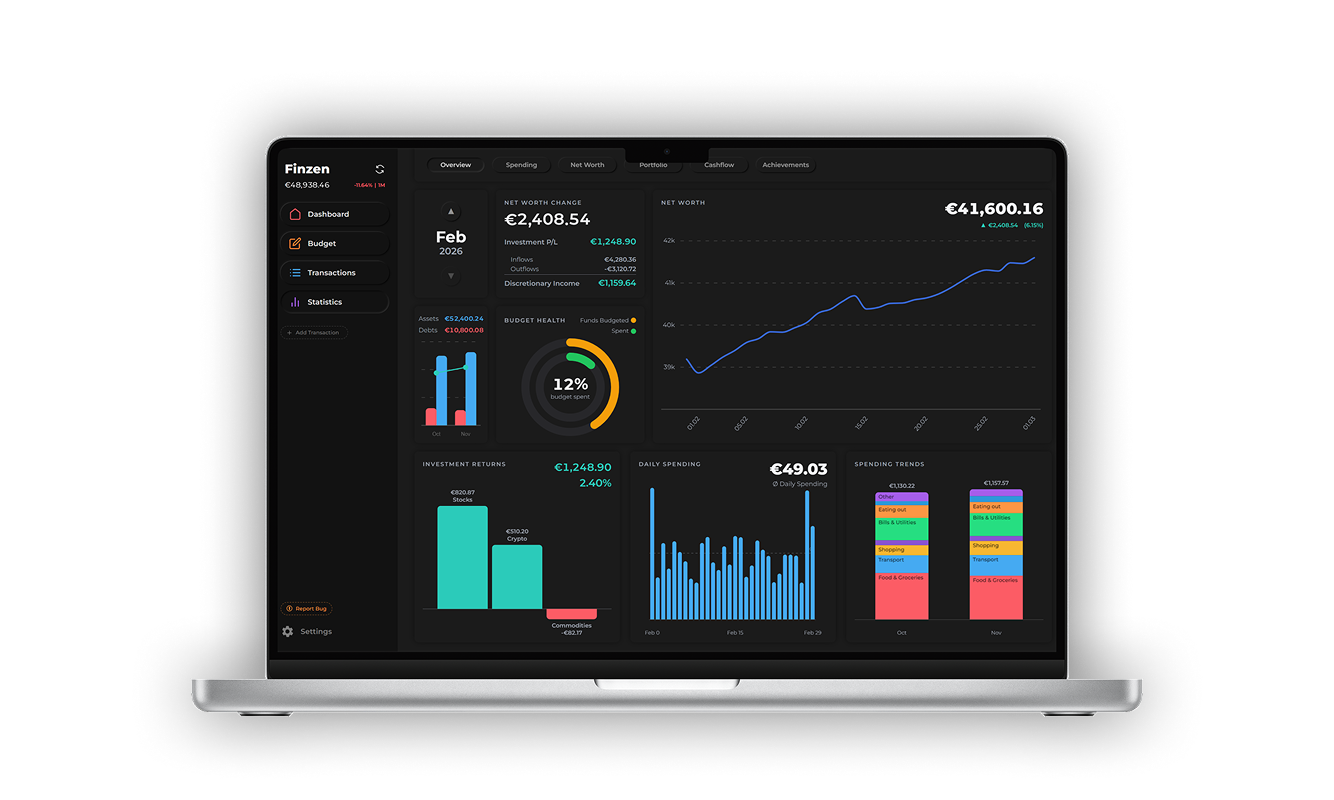
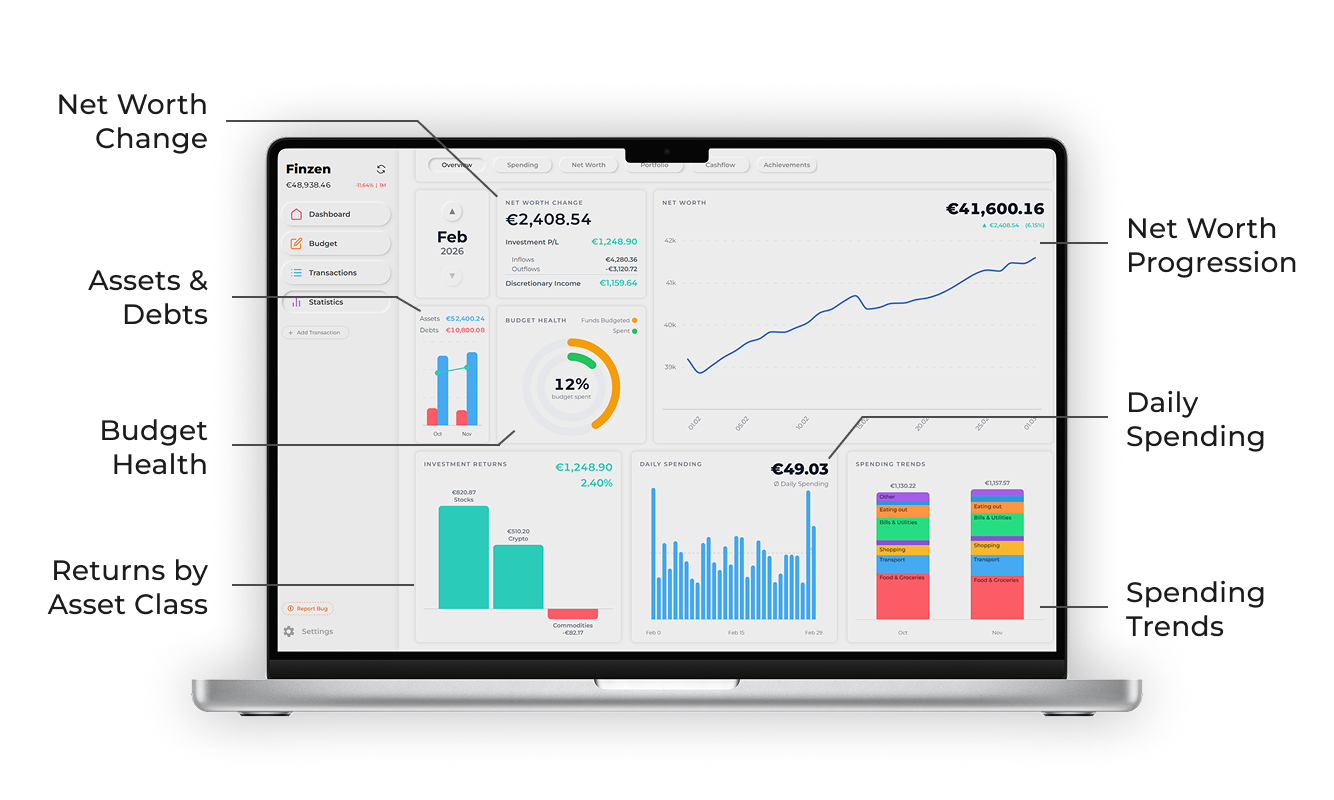
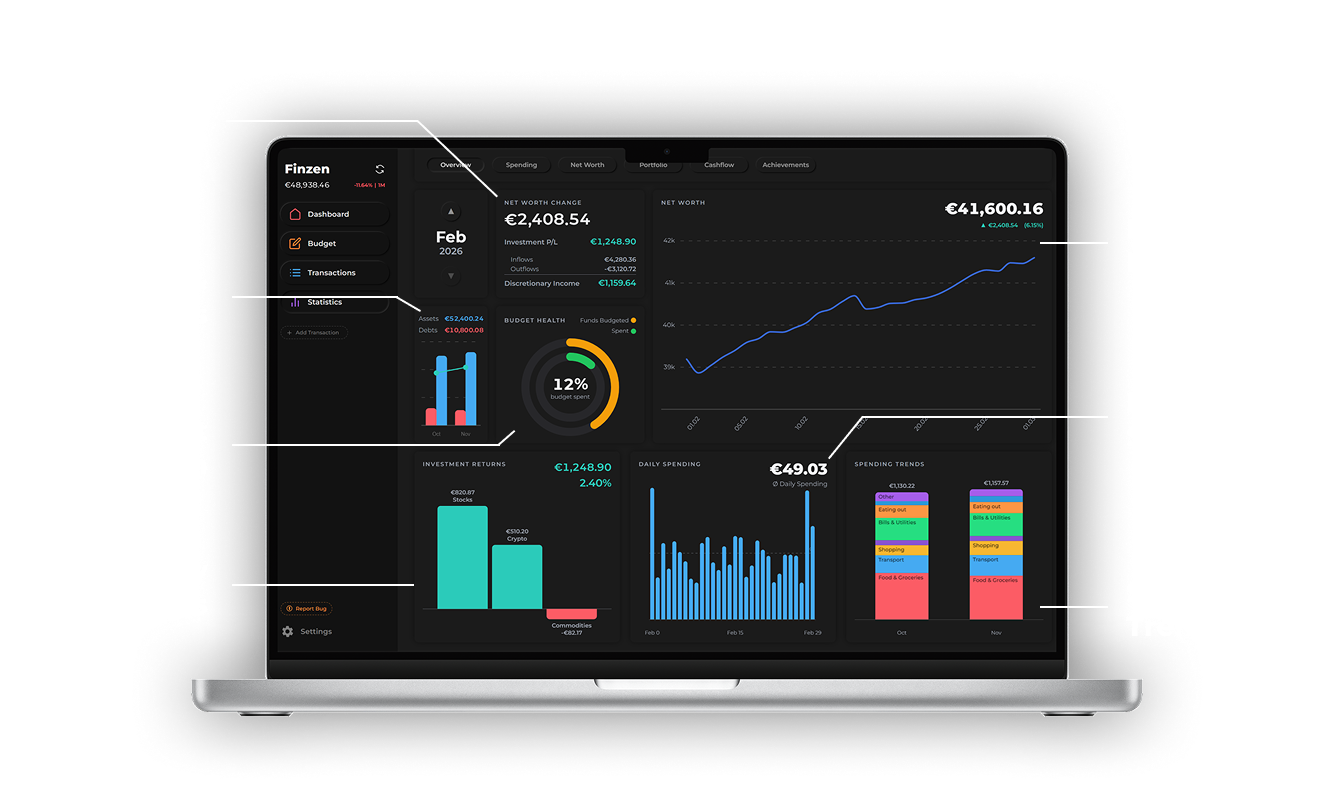
The Overview: Your Month at a Glance
Every number that mattered this month, organized into one clean, actionable report.
Most people end the month with a vague sense of how it went. Too much on dining out, maybe. A decent month for the portfolio. Probably saved something. Probably.
Finzen's Monthly Overview replaces that vague feeling with a complete picture. Every month you track gets its live own report: how your spending compared to your budget, how your net worth moved, what your investments returned, and your discretionary income.
One live report. Every month. No more guessing.
-
Net Worth Change
Did you end the month richer or poorer, and why. Income, Expenses, Investments.
-
Discretionary Income
What was left of your income after every bill, budget, and expense.
-
Assets & Debts
The value of everything you own and owe, side by side. Vs. last month
-
Budget Health
How much is left to budget, and how much of budgeted is left to spend.
-
Returns by Asset Class
What each part of your portfolio actually made or lost this month.
-
Spending Trends
How this month's habits compared to last month's, category by category.
The monthly overview compiles the most important metrics from across your Finzen dashboard into one convenient snapshot, updated in real time, so you always know exactly how your month is shaping up.
Your Cashflow, Mapped
Stop wondering where your paycheck went. The answer is right here.
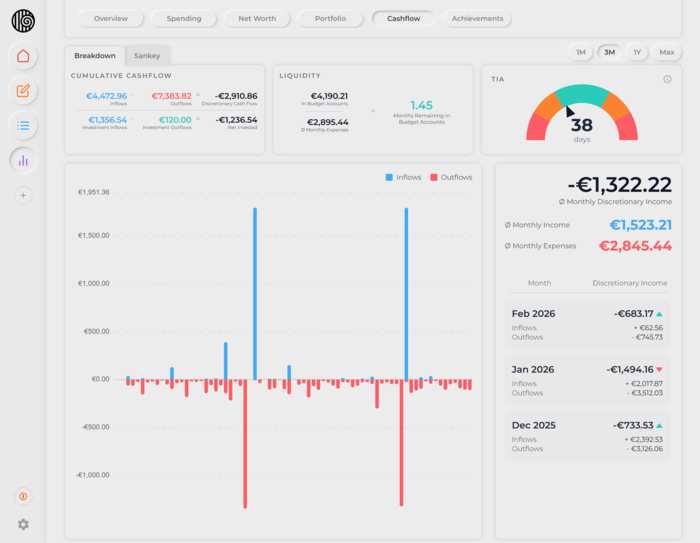
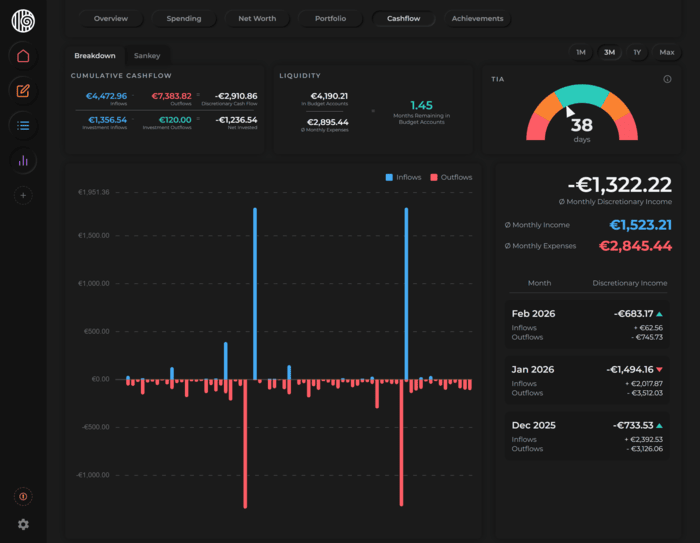
Cashflow Overview
The cash flow tab tracks every dollar moving in and out, updated in real time as you log. See daily and monthly inflows and outflows as clean bar charts, track your averages, and forecast how long your current balance will last based on your actual spending patterns.
Finzen even calculates how long money sits in your account before it leaves (TIA), turning cash flow from an afterthought into one of the clearest signals of your financial health.
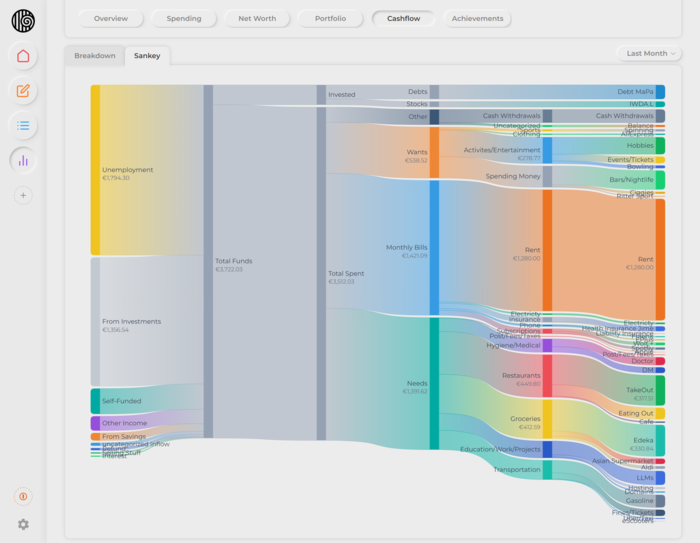
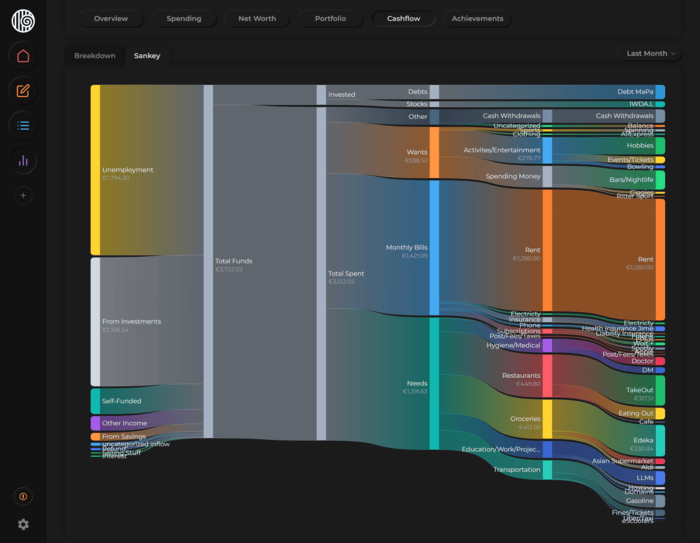
Sankey Diagram
The Sankey diagram traces every dollar from the moment it arrives to where it ultimately lands, across every spending category, savings bucket, and investment account.
Where most expense trackers give you numbers, the Sankey gives you flow. Patterns that hide in tables become impossible to miss when your entire financial picture is drawn out.
Smarter Spending Starts Here
See not just what you spent, but how your habits are shifting over time.
Spending Graphs
The spending tab breaks down every category and tag into clean donut charts and monthly bar graphs, so you can see not just what you spent, but how your patterns are shifting over time. Which categories are creeping up month after month? The monthly trend bars make it immediately obvious, without digging through transactions.
Drill into any category to see subcategory breakdowns, filter by tag, or zoom out to the full year.
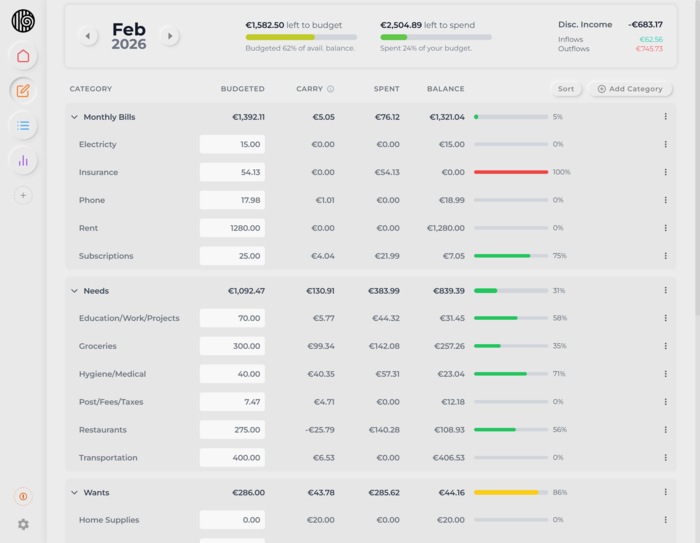
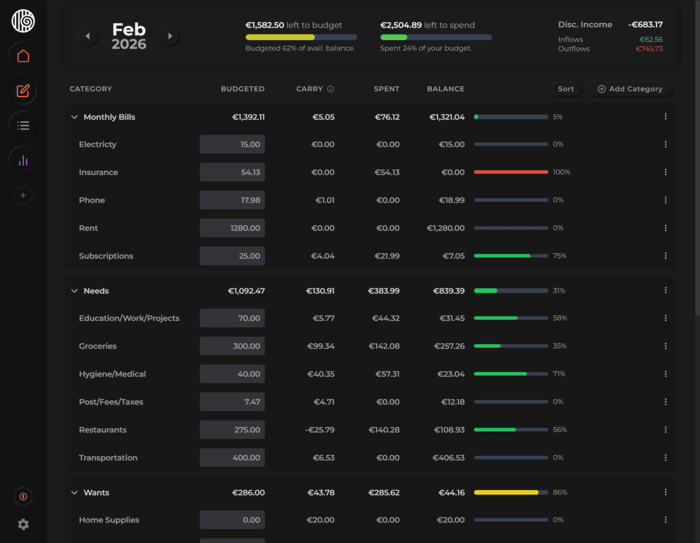
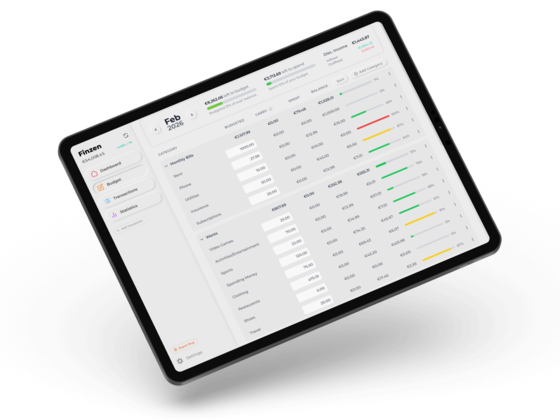
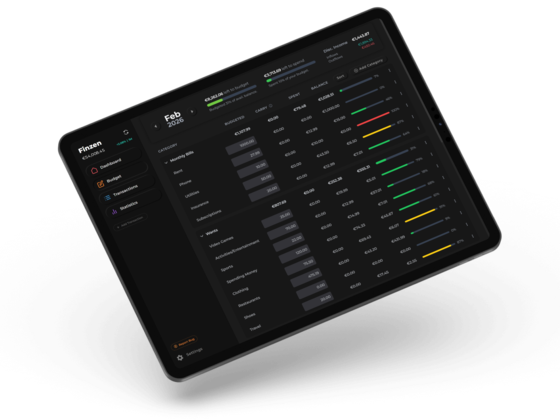
Budget Overview
The budget page is where intention meets reality. Set a spending limit for each category, log your transactions throughout the month, and watch your remaining balance update in real time. No mental math, no end of month surprises.
Every envelope shows you exactly how much you allocated, how much you have used, and how much is left, at a glance.
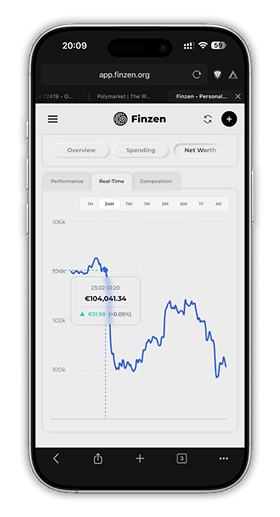
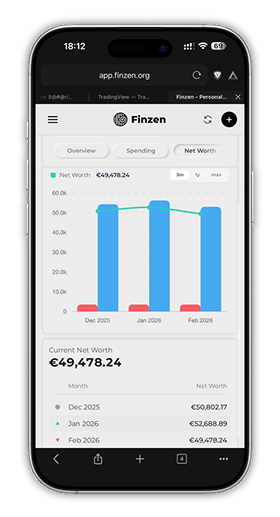
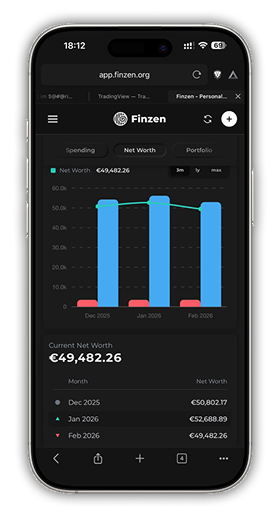
Net Worth: The Big Picture
Track your assets and debts in real-time.
Net worth is the single most honest number in personal finance. Not your salary, not your savings account balance, not how well your portfolio did last month — your net worth. Everything you own minus everything you owe. That's the number that actually tells you where you stand.
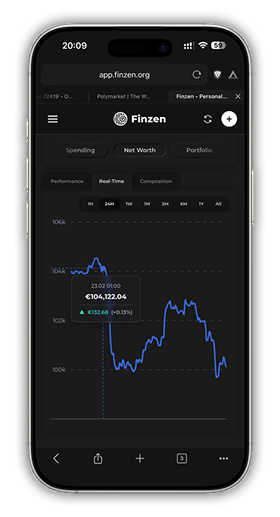
- Real-time net worth Your net worth updates the moment you log a transaction or the market moves, so the number you see is always the number you can trust.
- Monthly assets & liabilities Every month gets its own snapshot of what you owned and what you owed, so you can look back and see exactly how the balance has shifted over time.
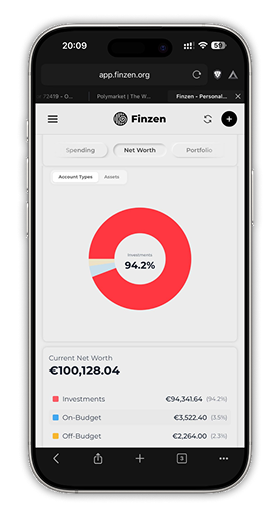
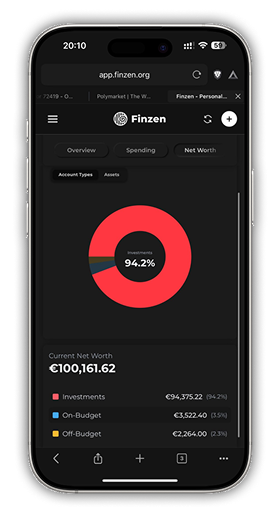
- Net worth composition See how your net worth is built, broken down by asset class, so you know not just what it is but what it's made of.
The Finzen Method
Small Practice. Big Picture.
1. Log
Spend 2 to 3 minutes a day entering your transactions. Manual logging creates connection.
2. See
Watch your charts, budgets, and reports update in real time as you log. Identify trends and patterns.
3. Grow
Feel connected to your reports and understand exactly how your finances are going through intuitive visuals.
Monitor your portfolio in one place.
Stocks, crypto, ETFs, commodities, forex - all your asset classes, one unified dashboard, institutional grade analytics.
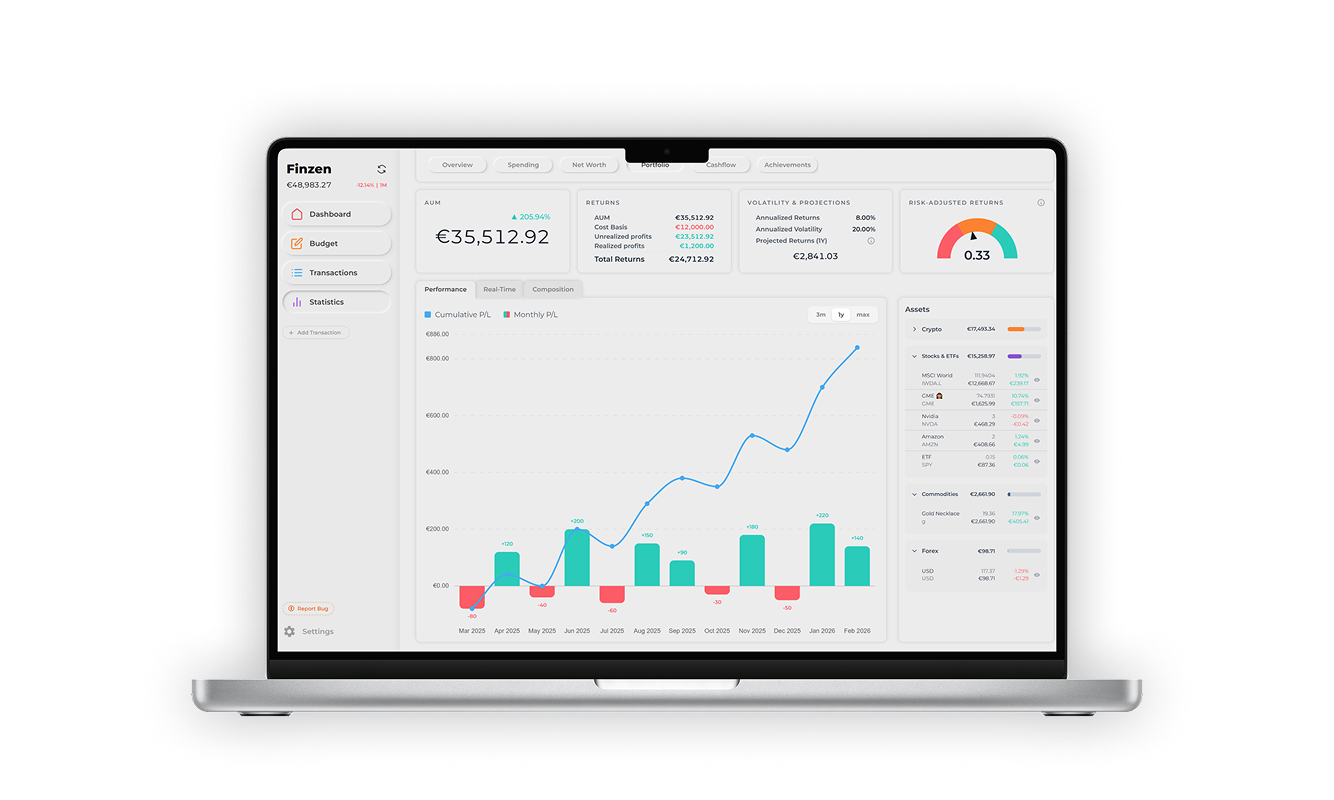
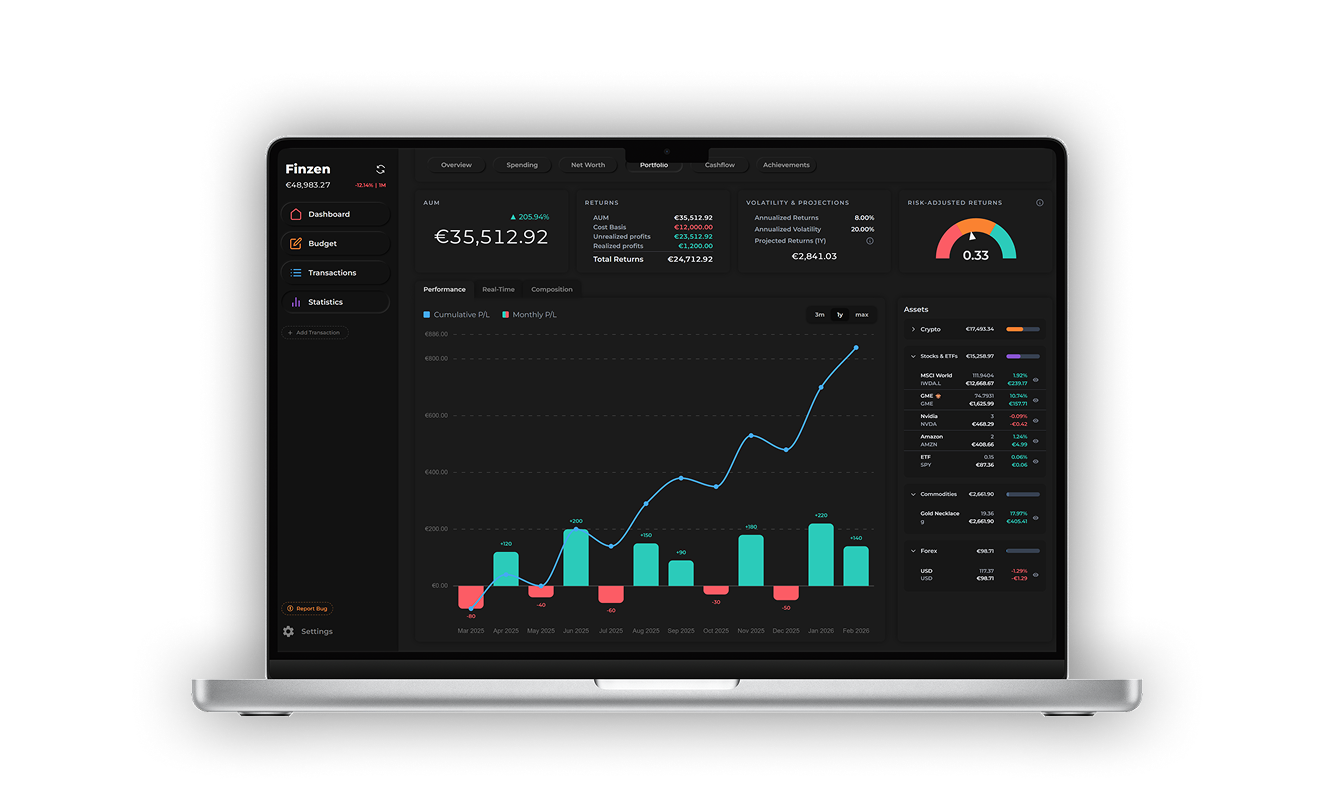
Portfolio tracking with Finzen tells you how you're actually performing.
Every asset you hold feeds into a unified performance view. Stocks, crypto, ETFs, commodities, forex, mutual funds across 15,000+ supported assets, updated in real time. Cumulative and monthly P&L charted over time. Per-asset breakdowns that show exactly how your portfolio is doing, regardless of your investment horizon.
For investors who want to go deeper, Finzen calculates risk-adjusted returns, annualized volatility, and Sharpe ratios alongside data-driven projections built from your actual track record. The same metrics professional wealth managers rely on.
Your Progress. Unlocked.
55+ Achievements to Unlock
Most finance apps make you feel behind. Finzen tracks how far you've come - through streaks, net worth growth, investing consistency, and cashflow habits. Every achievement is tied to real behavior, every rarity score shows you how few people got there, and every unlock tells you exactly what to chase next.
Small habits compound. So do the wins.
Weekend Warrior
Log transactions for 3 consecutive days
✓ Got it! · 2 days agoFull Week
Log transactions for 7 consecutive days
Progress: 0%
Locked
Requirement will become visible once unlocked
Unlock "Full Week" first
Common questions
-
No. Finzen is built around manual entry, which means no bank sync, no broker connections, and no exchange APIs. You log your transactions yourself — typically 2 to 3 minutes a day — and every chart, report, and visualization is generated from that data. Your financial picture stays completely private, and the charts update in real time as you log.
-
Most users find real value within the first month. Your monthly overview becomes meaningful after your first full month of logging, and charts like spending trends and net worth history get richer the longer you track. That said, your budget, cash flow, and Sankey diagram are useful from day one — even a week of data reveals patterns most people have never seen before.
-
Numbers in a spreadsheet tell you what happened. Visualization tells you what it means. When you can see your spending as a Sankey flow rather than a list of transactions, patterns that were invisible become obvious. When your net worth is a chart instead of a calculation, the trajectory becomes motivating rather than abstract. Research consistently shows that people who have a clear visual understanding of their finances make better spending decisions, save more consistently, and feel significantly less anxiety about money. The goal of financial data visualization is not to make things look pretty — it is to make the right action feel obvious.
-
Yes. Finzen works on both desktop and mobile, and the charts and reports are fully accessible on both. Most users log transactions on mobile throughout the day and review their reports and visualizations on desktop, though both experiences are designed to be clean and intuitive.
Take Control of Your Money
Free to get started. No credit card. Log your first transactions today and watch your financial picture come to life in real time. Spending flows, net worth trends, portfolio performance. Every chart builds itself from your data, two minutes a day at a time. Start logging. Start seeing.
Continue exploring
Budget & Track Spending
Give every dollar a purpose. Set spending envelopes by category, log purchases as you go, and see your remaining budget update in real time.
Portfolio & Net Worth
Stocks, ETFs, crypto, forex, and commodities - all in one beautiful dashboard. Track your performance, and watch your net worth grow in real time.
The Finzen Method
Spend 2-3 minutes a day logging your expenses and you'll understand your money better than any bank sync ever could. No automation. Just awareness.